In this story
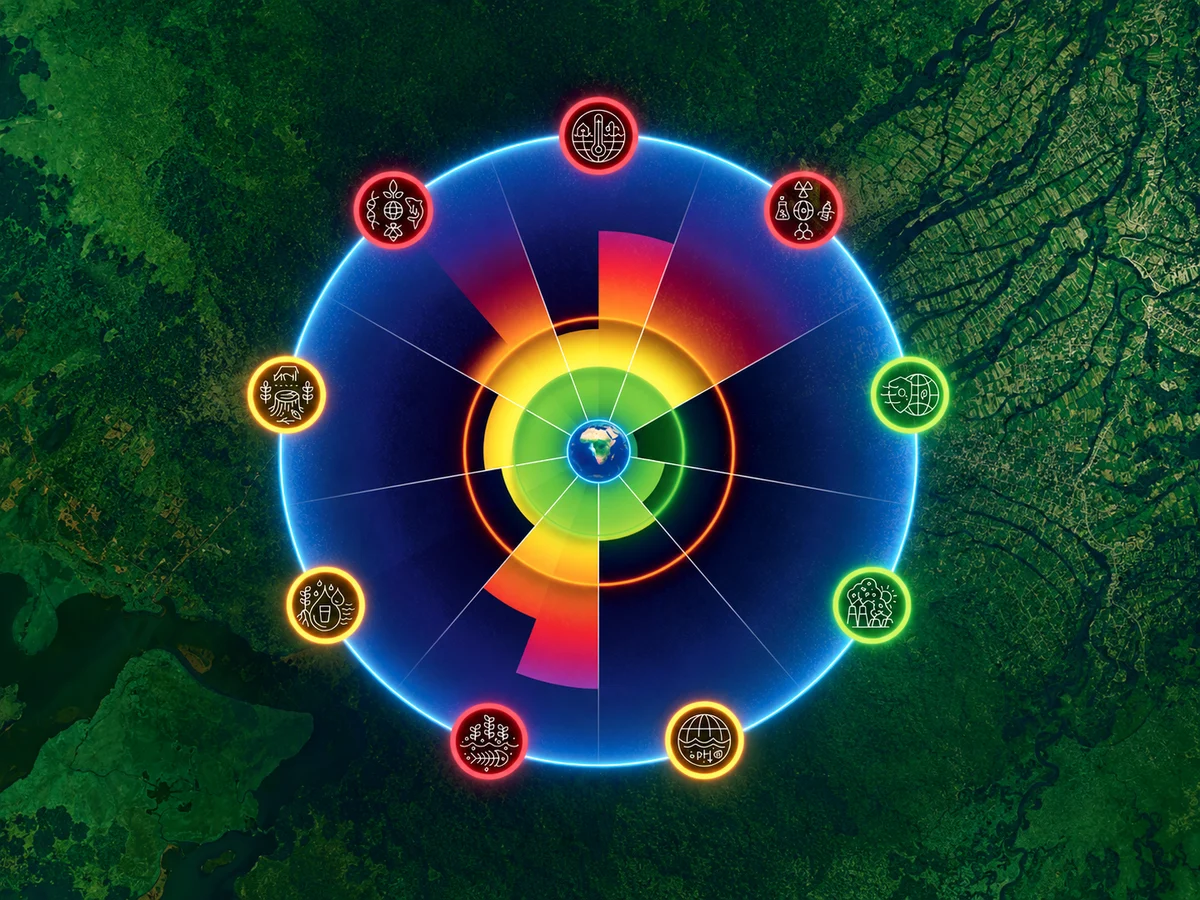
The circle has become an environmental icon. Nine segments surround a green centre. Some extend into yellow and red, as though Earth were a dashboard with nine separate warning lights. It is a useful way to see the Planetary Health Check 2026 at a glance. It is also an invitation to misunderstand it.
The segments describe distinct processes and the indicators scientists use to assess them. The planet does not have nine compartments. A forest draws carbon from the air, sends moisture back into it, holds soil and hosts life. Carbon dioxide from fossil fuels warms the atmosphere and changes seawater chemistry. Fertilizer applied on land can eventually alter the water reaching an estuary. The same human activity can register in several parts of the circle, while a change in one process can make another more vulnerable.
That is the story behind the headline number. The report finds seven of nine planetary boundaries transgressed. Those seven are climate change, biosphere integrity, land-system change, freshwater change, biogeochemical flows, novel entities and ocean acidification. Stratospheric ozone depletion and atmospheric aerosol loading remain within the assessed global safe operating space. But a count alone says little about how pressures travel, where the evidence is strongest, or which interventions solve one problem while moving another.
The more revealing question is this: what happens to a connected system when several of its buffers are strained at once?
A boundary is a precautionary limit for risk. Crossing it is neither a forecast of collapse tomorrow nor proof that every place is affected in the same way.
The stable world in which civilisation grew
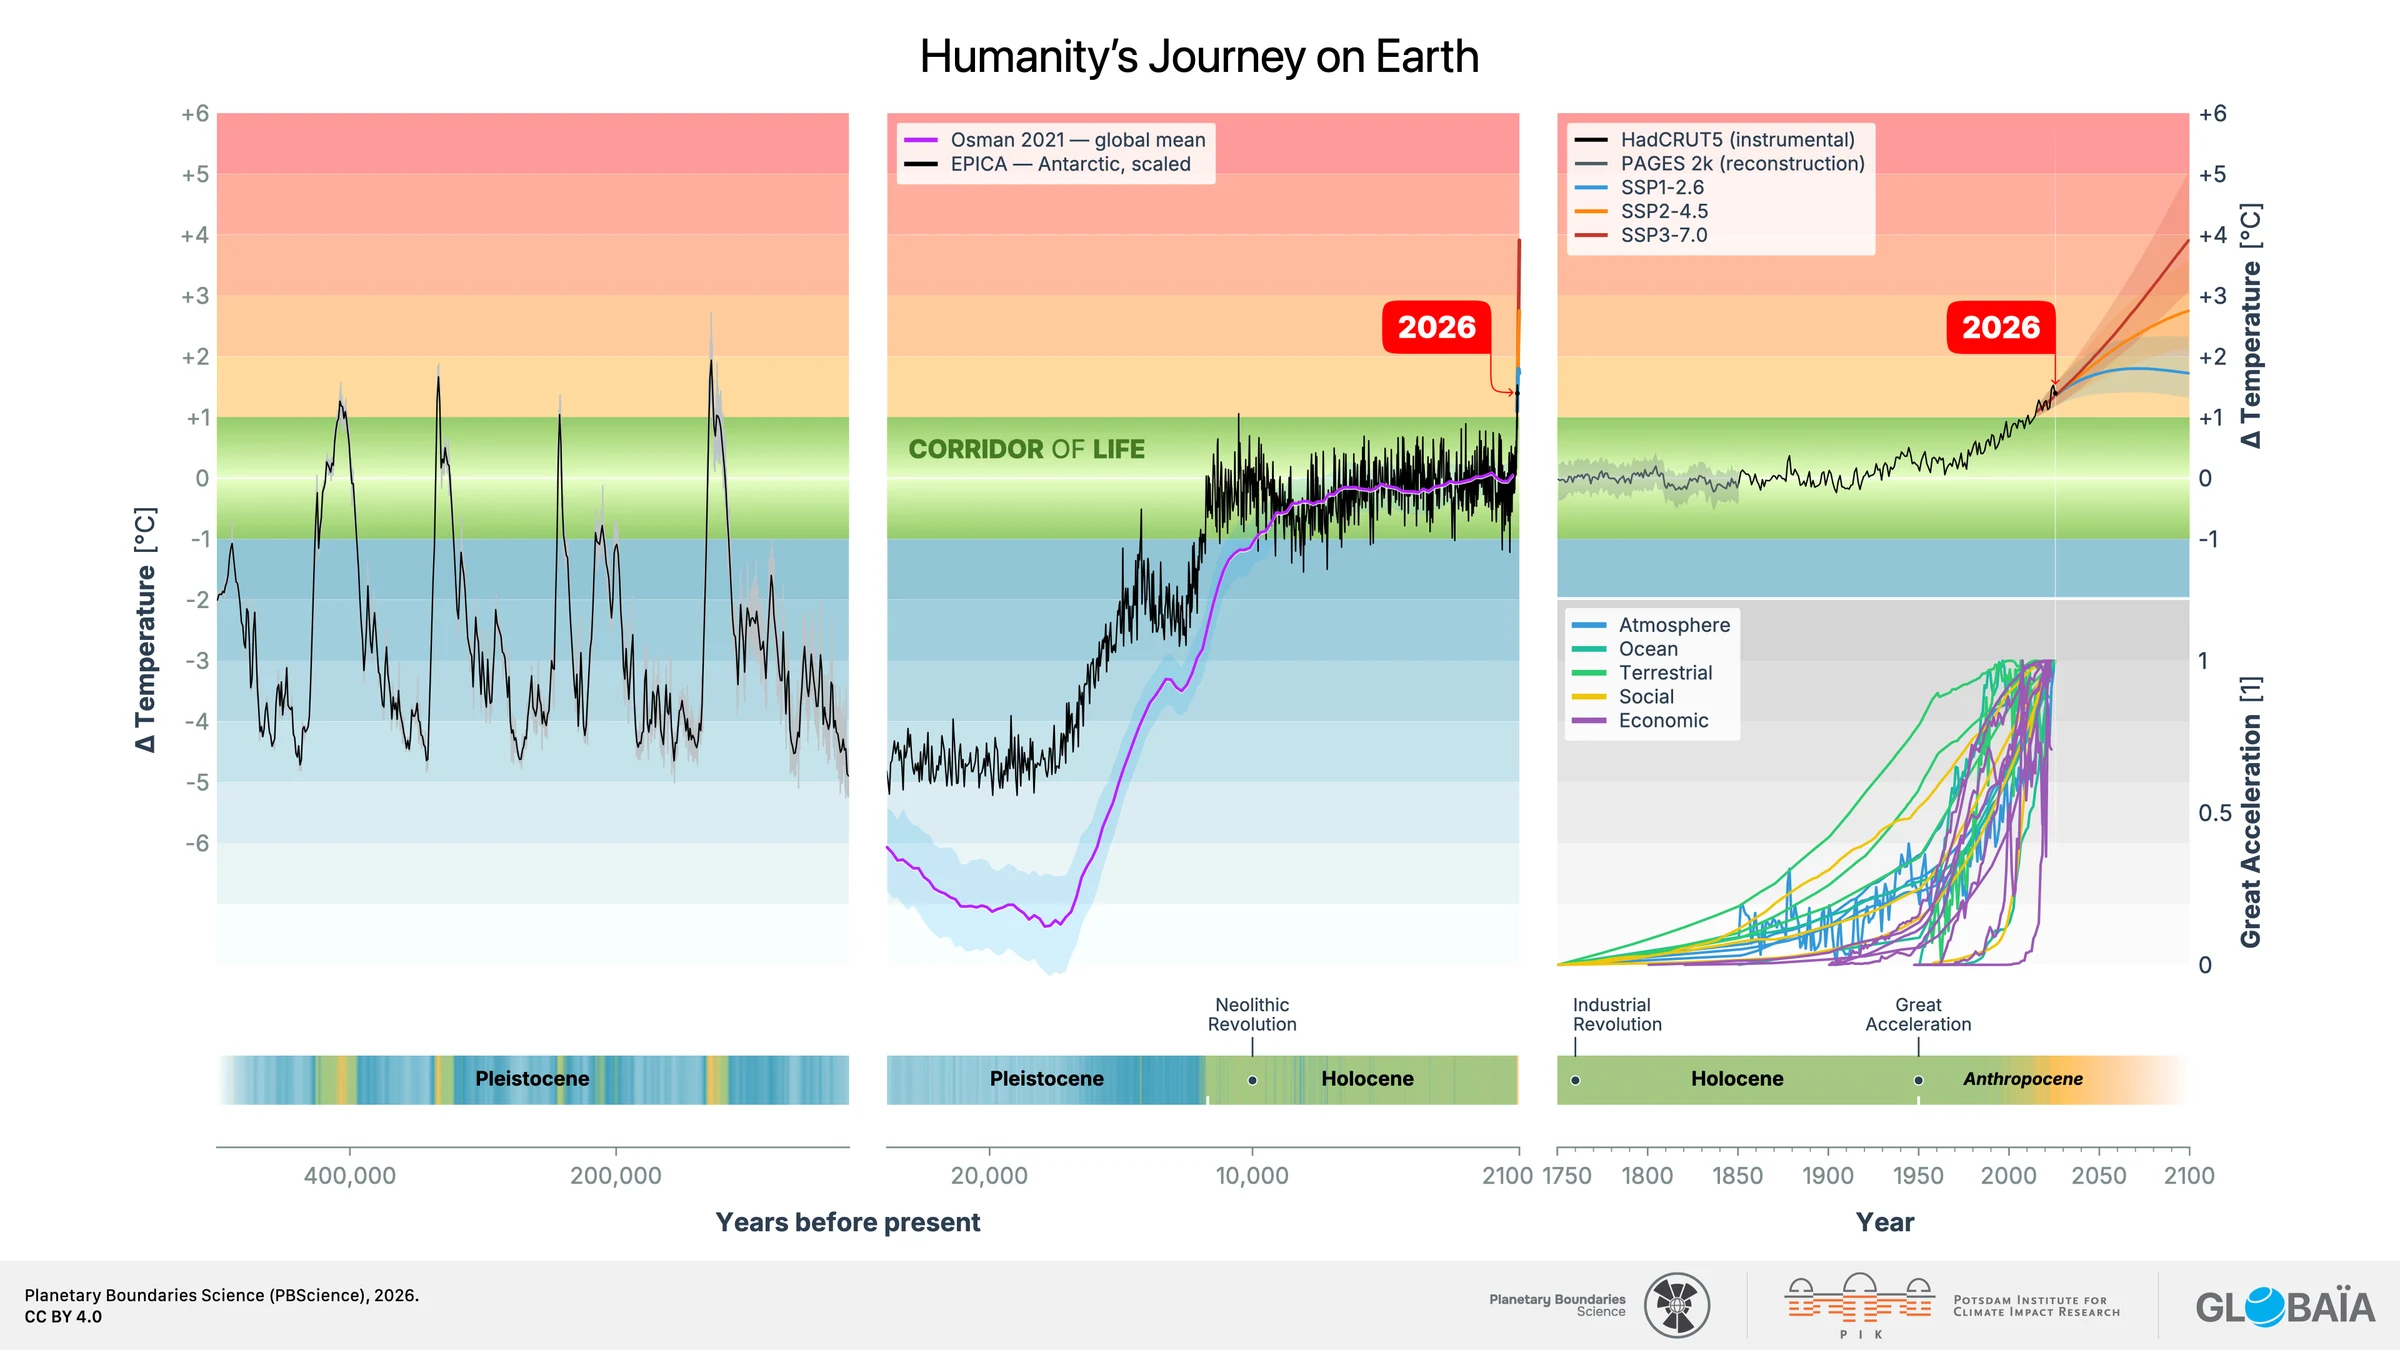
For most of the past 11,700 years, human societies developed during the Holocene. That period was not weather without extremes, or an untouched planet. It was a relatively stable interval in Earth’s long climate history. Agriculture, settled communities and eventually cities emerged within its conditions. The 2026 report uses that history as a reference point: the question is how far human pressures are moving the Earth system from the state in which complex societies took shape.
Stability is more than a comfortable average temperature. It depends on relationships among climate, the water cycle, fertile soils, living communities and the chemical composition of the atmosphere and ocean. These systems can absorb disturbance, but not without limits. A forest can recover from one dry year; repeated heat, fragmentation and fire may leave it less able to recover from the next. A coastal ecosystem can tolerate some nutrient input; continued loading, warmer water and oxygen loss can make recovery much harder.
This is why the Holocene matters to the story without becoming a myth of perfect equilibrium. It offers a comparison for the conditions under which human institutions were built. It does not provide an exact temperature setting to which every ecosystem can simply be returned. Nor does it make a global average a substitute for local experience. The report’s boundary indicators are a way to ask whether the planet’s stabilising processes are being pushed beyond ranges judged to carry low risk.
Then the curves bent upward
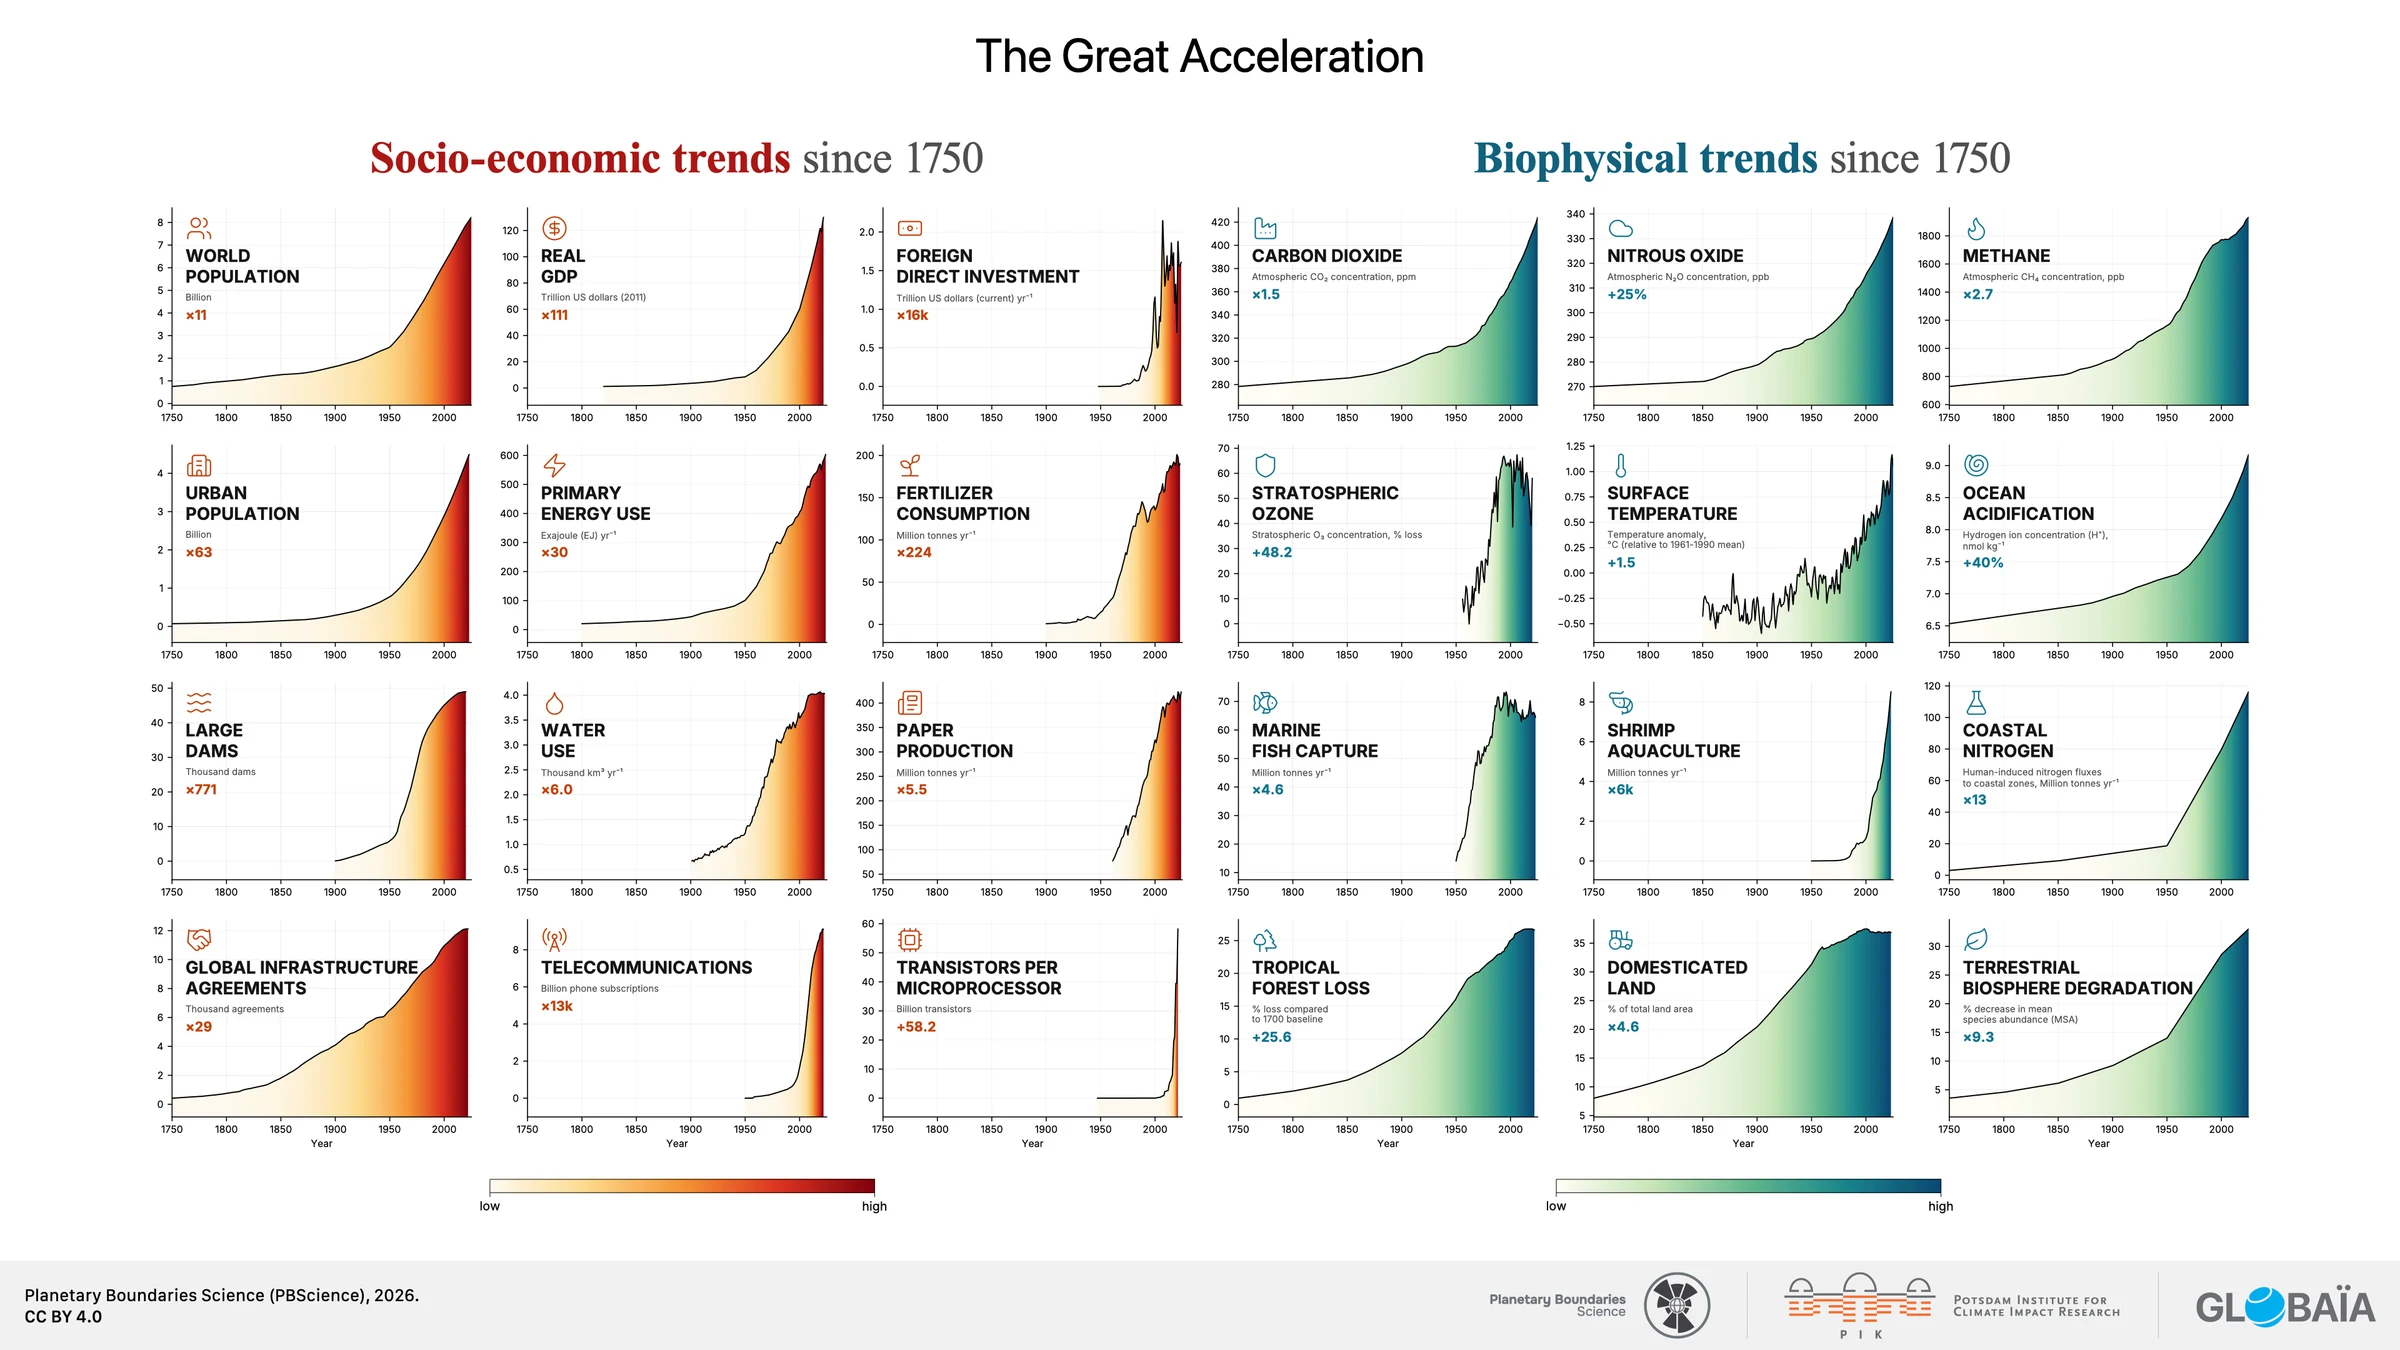
The report’s “Great Acceleration” describes a striking pattern, especially after the mid-20th century. Energy use, production, land conversion, resource extraction and pollution expanded alongside population and economic activity. In Earth-system records, associated pressures and changes appear in atmospheric carbon dioxide, biodiversity, nutrient cycles, water and more.
The point is not that every line rises smoothly or that every country contributed equally. They did not. Nor does a chart of simultaneous increases prove every causal connection. The point is the scale and pace at which human activity became a planetary force. What had been described as separate environmental questions began to occupy the same global picture.
An emissions inventory might follow carbon from a power station. A water agency might measure altered river flows. A conservation team might monitor species loss. Those measurements are essential, but the boundaries reveal why their results cannot be read in isolation. Energy, food, land use, materials and infrastructure are shared drivers. A decision in one sector may affect several control variables through different pathways and over different timescales.
The contrast between social activity and biophysical change gives this story its first turn: our institutions often divide responsibilities by department, while the physical system links the outcomes.
Seven lines crossed, two still inside
“Seven of nine” is a serious diagnosis, but it needs a careful reading. A planetary boundary is a scientifically proposed guardrail, set to keep the risk of large-scale destabilisation low. Beyond it lies a zone of increasing risk, and for some variables a high-risk zone. The exact risk is not identical across boundaries. The 2026 assessment uses 13 control variables across the nine processes; it combines observations, modelling and scientific judgement. Some variables and thresholds are more uncertain than others.
The seven transgressed processes also differ in what they measure. Climate change includes atmospheric carbon dioxide and human-caused radiative forcing. Freshwater change considers both “blue” water in rivers and lakes and “green” water held in soils. Biosphere integrity addresses extinction and the functioning of living systems. The novel-entities assessment concerns the pace at which human-made substances enter the environment relative to our capacity to assess and govern them; it is not a single global toxicity reading. Ocean acidification crossed the boundary in the 2025 assessment, becoming the seventh; the 2026 report confirms its continued transgression.
The two boundaries inside the global safe operating space also need context. Stratospheric ozone has benefited from international controls on ozone-depleting substances. Global atmospheric aerosol loading is assessed as inside its boundary, while severe regional aerosol pollution persists, notably in South Asia. “Inside” is therefore not a licence to ignore health impacts or regional change. Equally, “outside” does not mean a named tipping point has already been crossed.
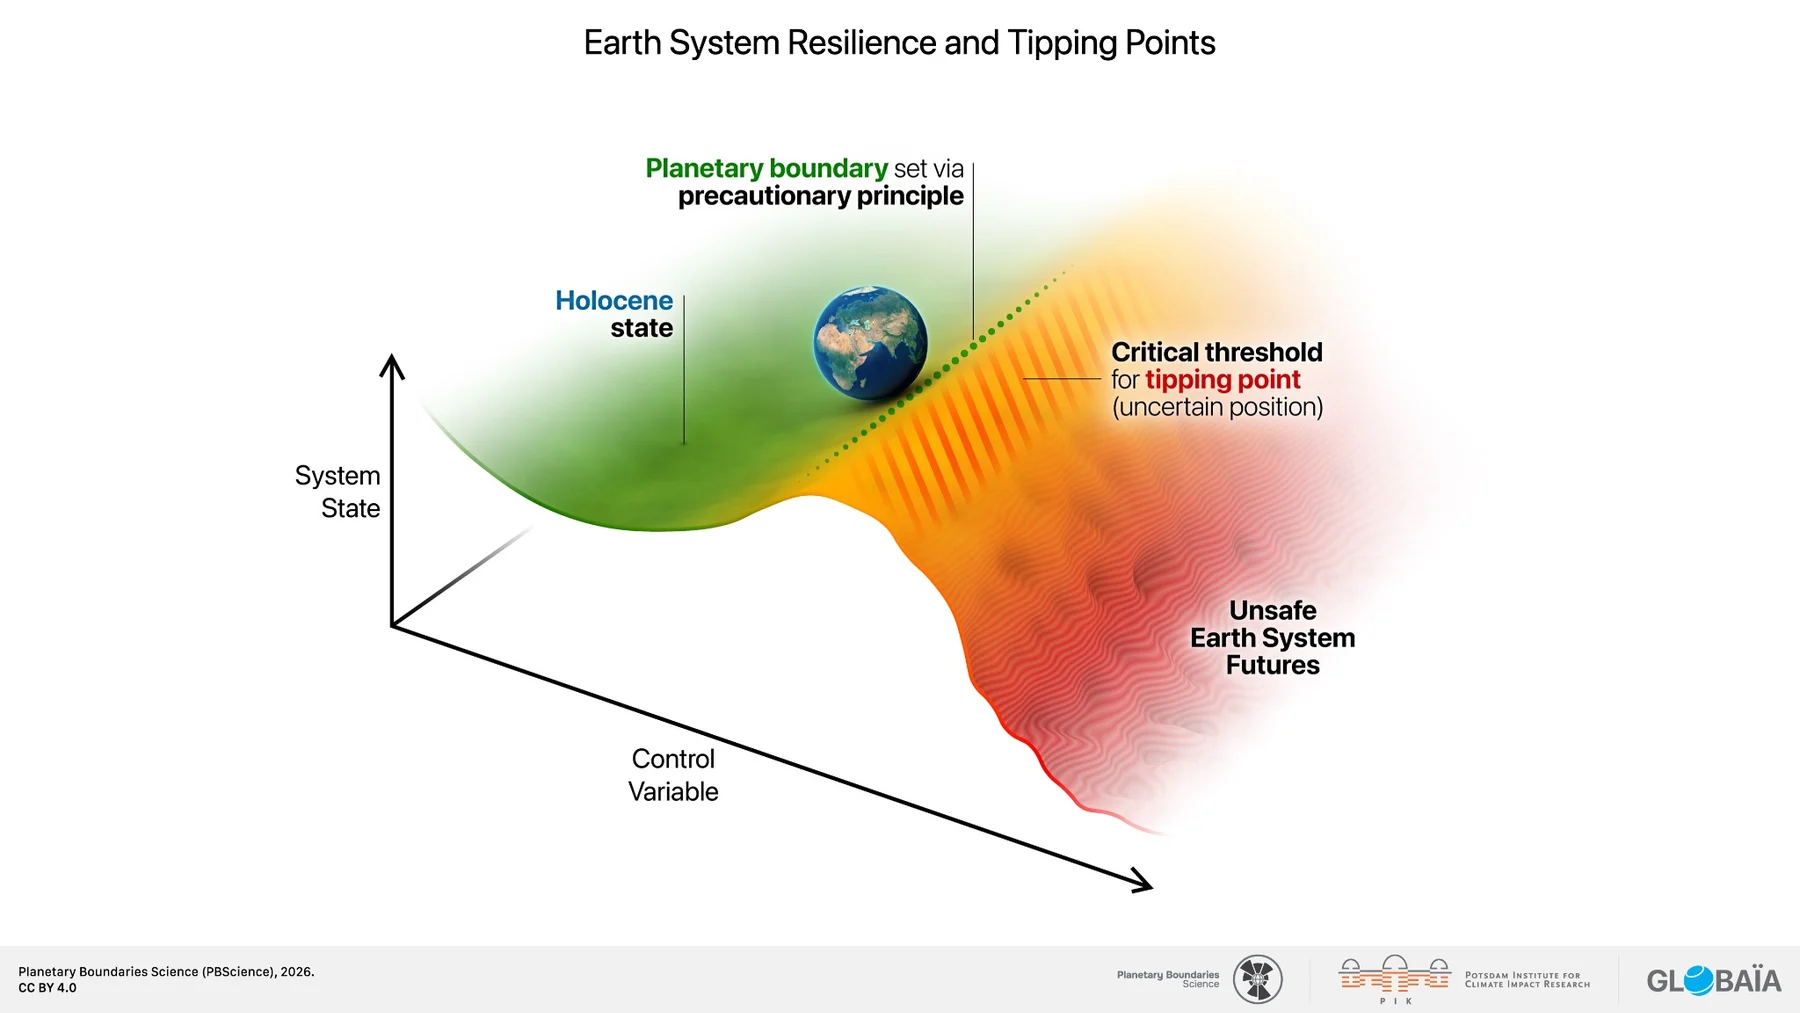
The distinction matters politically as well as scientifically. Calling each breach an immediate collapse can make the evidence sound more certain than it is. Treating the boundary as a distant hypothetical can make the risk sound less urgent than it is. The relevant fact is that the report finds rising pressure in all seven transgressed processes, while the margin for staying within a lower-risk Earth-system state narrows.
The lines between the lines
On one page of the report, the familiar wheel gives way to a network. Figure 8 draws directional links between boundaries and shared human drivers. It is selective rather than complete: the authors show the best-understood interactions, not every possible connection. Even that partial view changes the reading of the diagnosis.
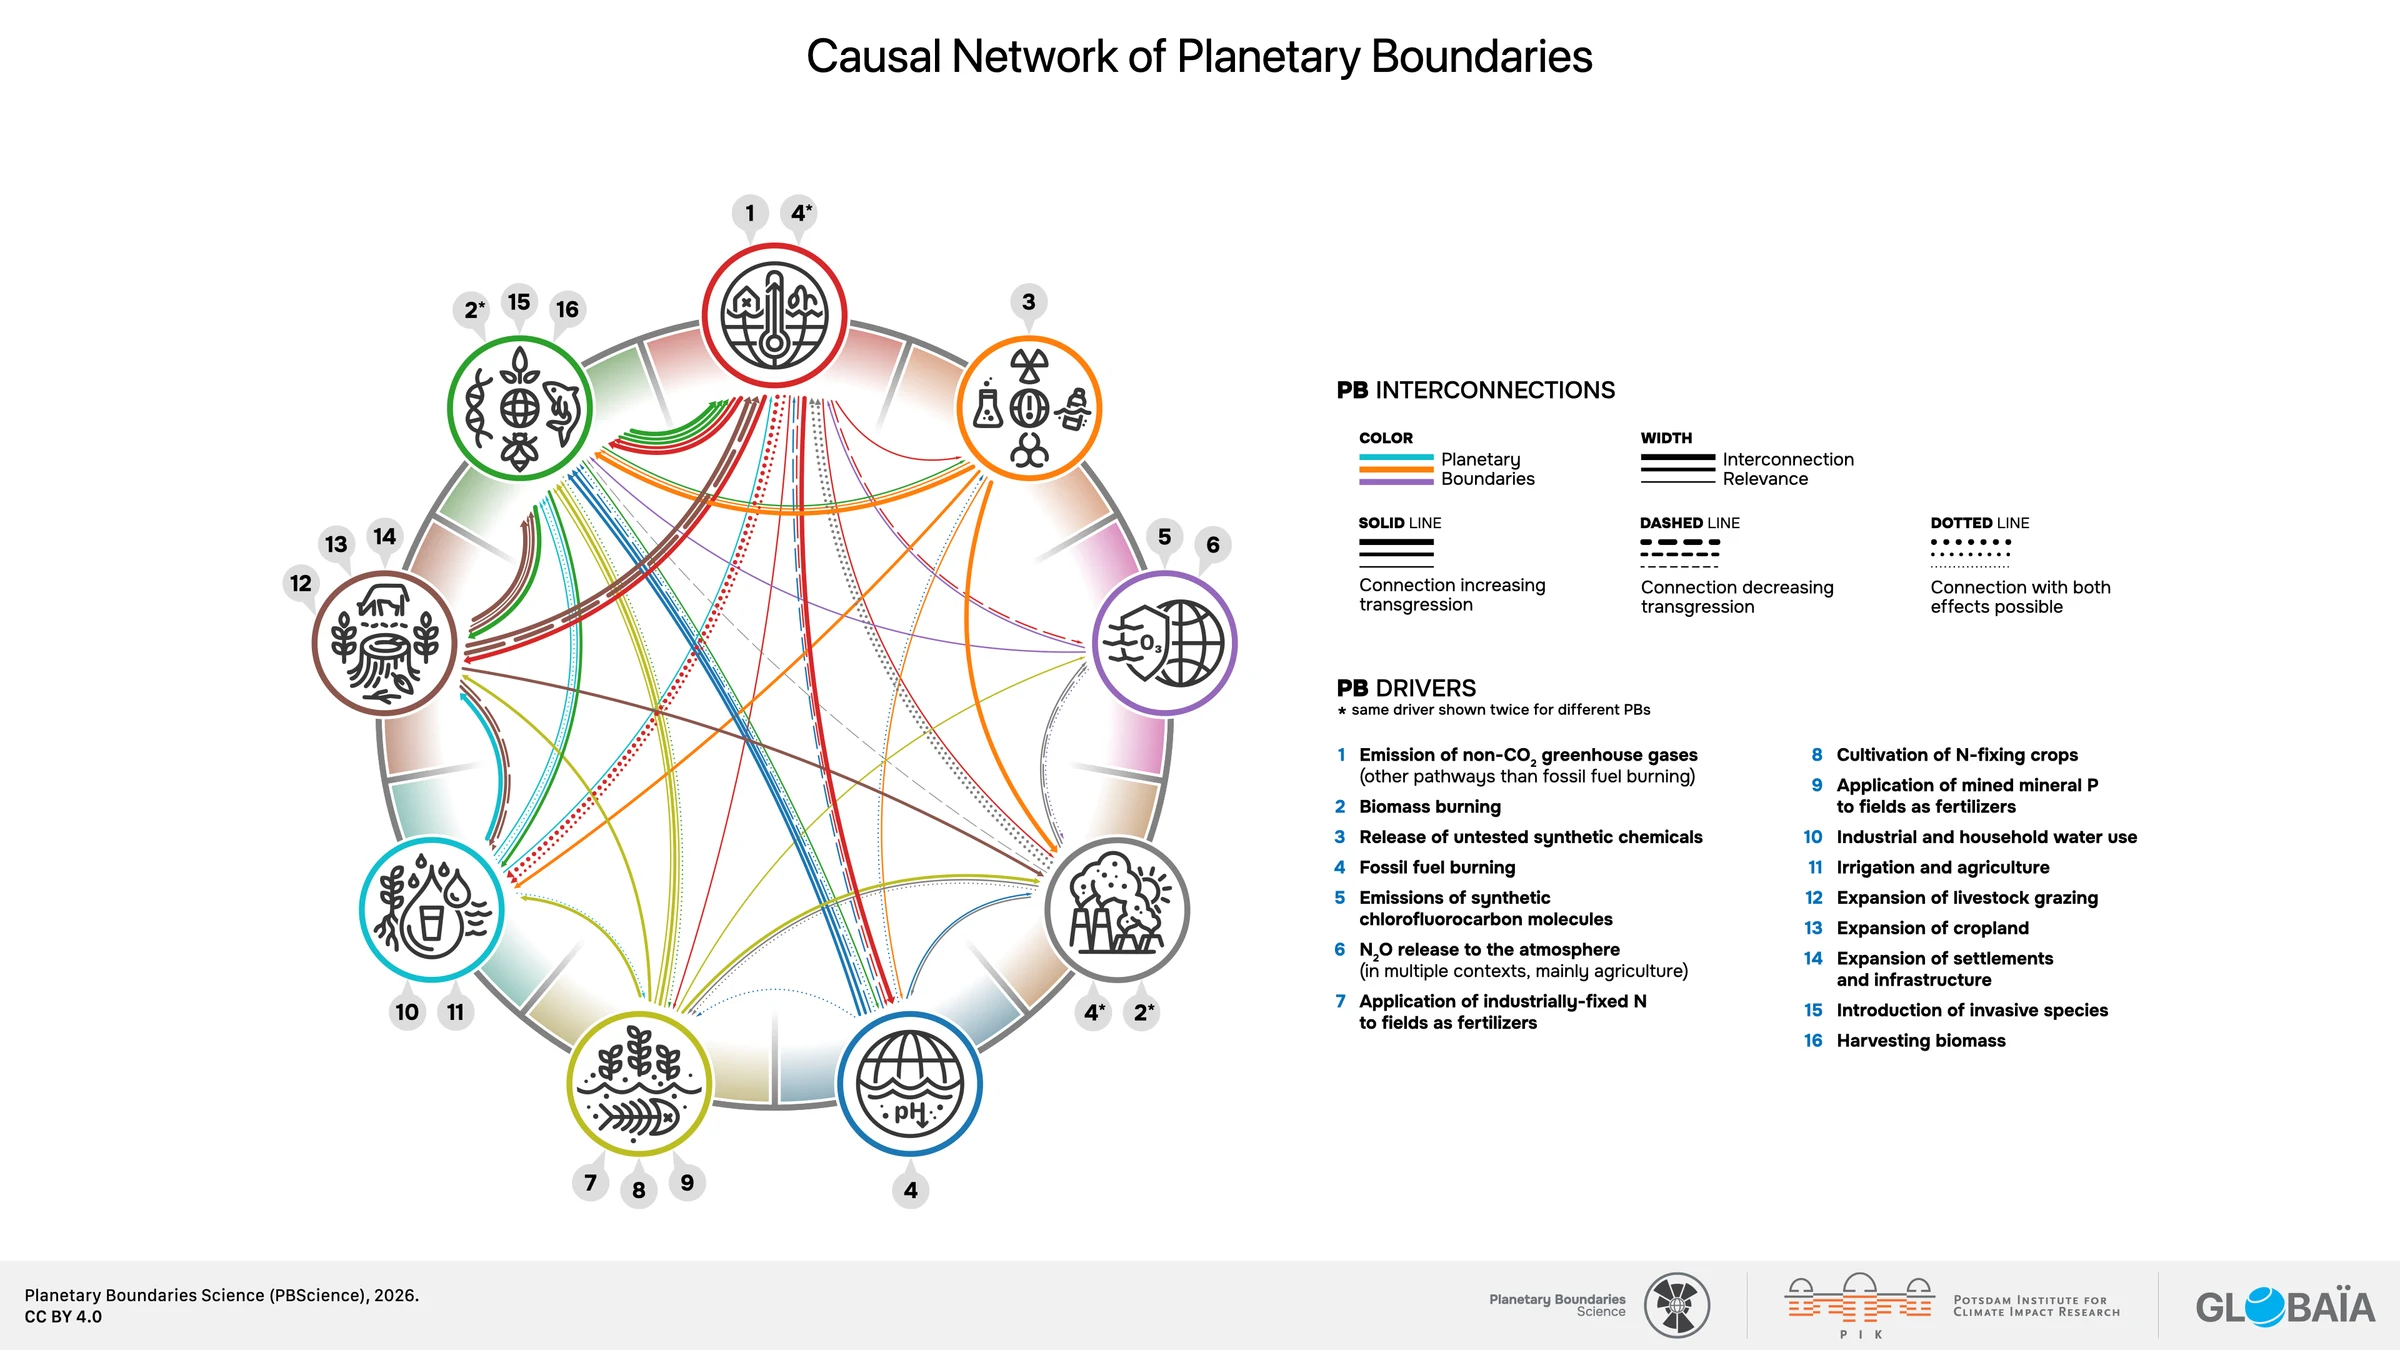
Consider fossil fuels. Burning them raises greenhouse-gas concentrations, contributing to climate change. The additional carbon dioxide absorbed by the ocean alters seawater chemistry, contributing to acidification. Combustion also releases particles that influence aerosol loading and damage health. One source, three very different pathways. Cutting that source can therefore reduce pressure across several processes, though the speed and size of the benefits differ.
Now consider a forest. It is habitat, carbon store, water pump and local climate regulator at once. Remove tree cover and one loses living communities and stored carbon. Evapotranspiration and rainfall patterns can change. Hotter, drier conditions can increase fire risk, which in turn threatens remaining forest. Here the boundary categories describe different consequences of interacting changes, not independent problems with independent fixes.
There are also trade-offs. An intervention that reduces emissions but requires large land conversion, heavy water use or poorly managed chemical inputs may ease one pressure while adding another. That does not invalidate the intervention. It makes the whole-system assessment essential. The report argues for actions that create benefits across boundaries without shifting pressure elsewhere. In practice, that requires specifying geography, supply chains, lifetimes and affected ecosystems, not merely naming a technology “green.”
The network does not mean every risk amplifies every other risk. Some interactions dampen change; others vary by place or context. It does mean the condition of one boundary can alter the consequences of another. The report notes that boundaries have largely been positioned under a simplifying assumption that other processes are not already substantially transgressed. With seven breached, that assumption becomes increasingly consequential.
The carbon sink that looks strong—until it doesn’t
Land and ocean absorb part of the carbon dioxide humans release. That uptake has slowed atmospheric accumulation and warming compared with a world without those sinks. It is tempting to look at the land sink as a dependable service, a line in a carbon budget that can be projected forward. The 2026 report asks how dependable it really is.
The global net number can hide considerable damage. A forest region can lose carbon to fire while regrowth or increased uptake elsewhere offsets the loss in a global total. A positive land sink does not prove that the biosphere is healthy. Nor must land become a net source for its buffering function to weaken. If it absorbs less than expected, more of our emissions remain in the atmosphere, even while land is still absorbing carbon overall.
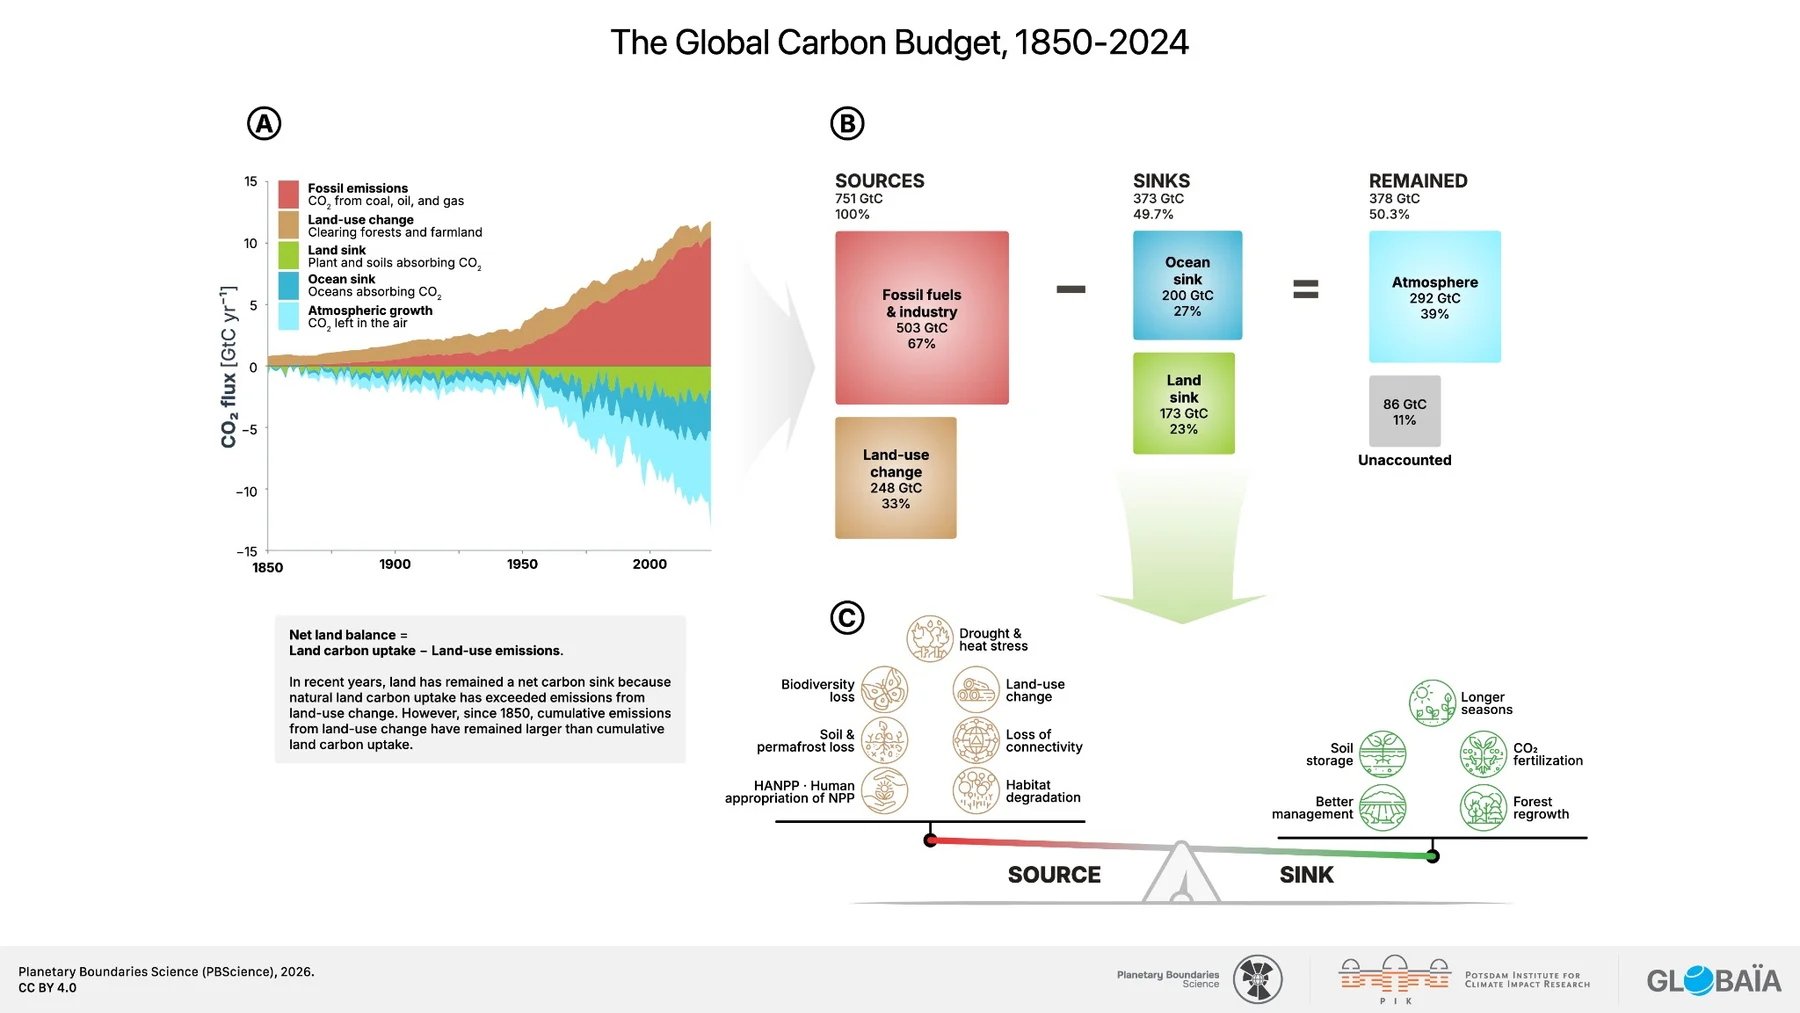
Heat, drought, pests, fire, soil degradation and fragmentation can interact. Elevated carbon dioxide can help plants grow in some conditions, but water and nutrients constrain that response. A warmer atmosphere can lengthen growing seasons in some places while making damaging extremes more frequent in others. A forest that stores more carbon can also contain more carbon exposed to future disturbance. These are reasons to scrutinise resilience rather than to assume one uniform global trend.
The report’s concern about modelling is specific. Large-scale Earth-system models often represent vegetation through simplified plant types and broad grid cells. Real forests contain species with different ages, root systems, local adaptations and vulnerability to repeated stress. Models are indispensable for understanding possible futures, but they may represent recovery more smoothly than recovery occurs on the ground. The report frames this as a risk of overestimating resilience, not as proof that the global land sink has ended or will end at a known date.
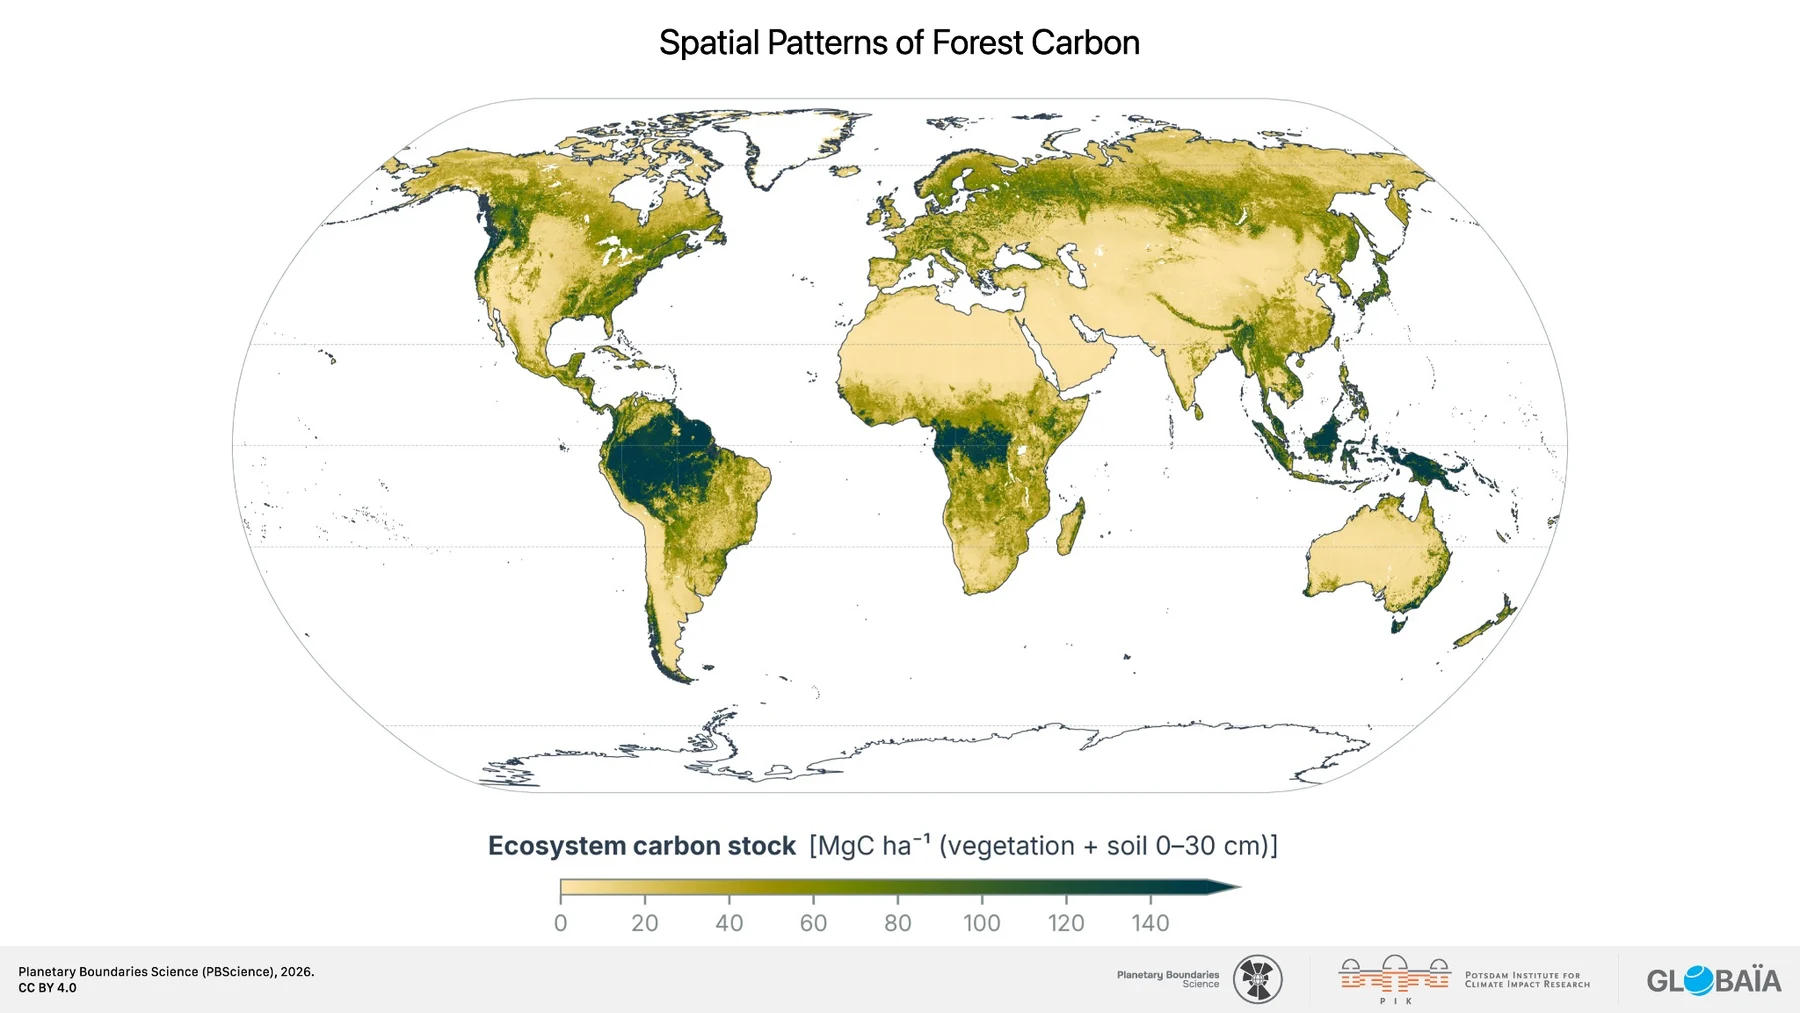
That map is an image of assets at risk. It cannot tell us by itself whether a forest is gaining or losing carbon this year. To answer that, researchers need observations of fluxes, disturbance and recovery. The distinction between stock and flow is a small technical detail with large consequences for public debate: protecting what is stored and maintaining future uptake are related, but they are not the same task.
The ocean floor belongs in the picture
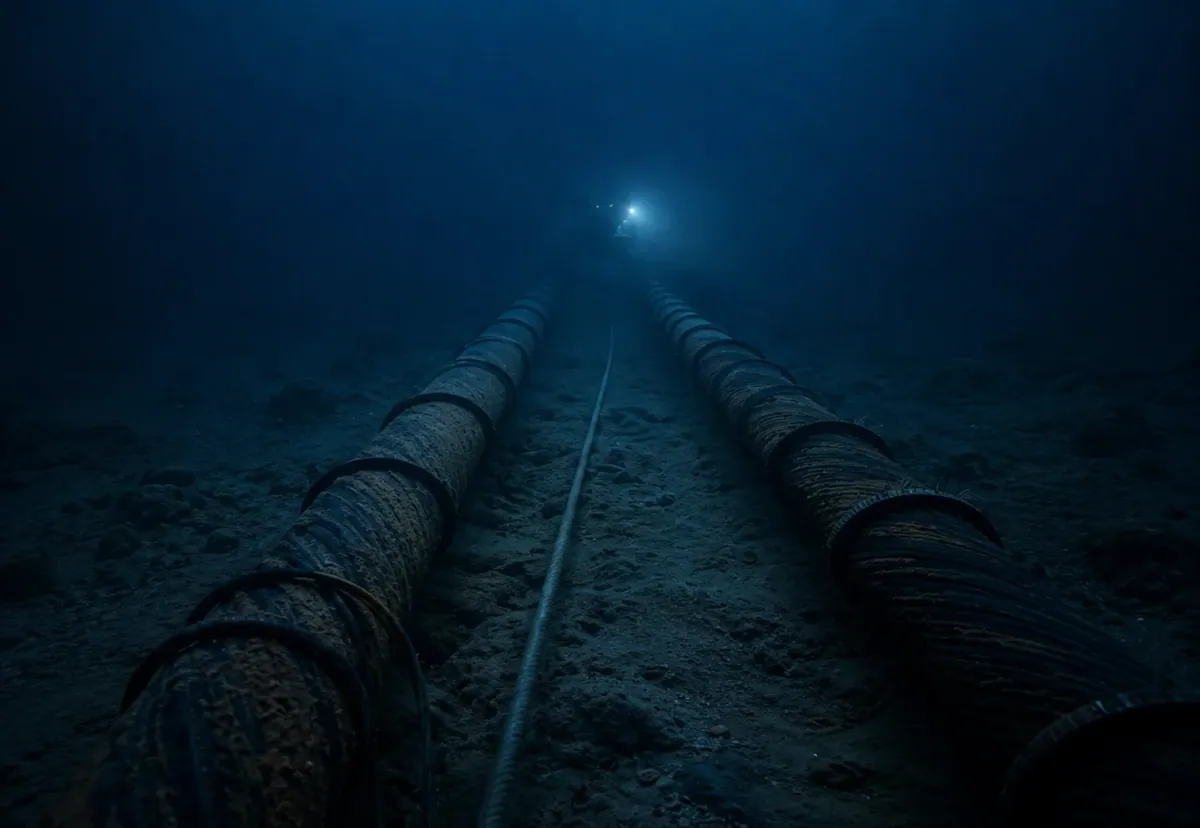
There is no tenth planetary boundary called “seafloor integrity” in the 2026 wheel. The report gives it a spotlight chapter because the bottom of the ocean connects biodiversity, nutrients and carbon in ways that the nine-part diagram can conceal.
Seafloor habitats are living structures. Burrowing animals, microbes, reefs and sponge grounds process organic matter, shape sediment chemistry and support food webs. On continental shelves, bottom-contact fishing gear can physically disturb those habitats. The report estimates that bottom trawling affects roughly 1–2% of the global seafloor each year, with much of the activity recurring on productive shelves. That figure describes area disturbed, not a claim that every affected place is damaged equally or permanently.
Marine sediments also hold large stores of organic carbon. Disturbing them can resuspend material and expose it to oxygen. What fraction of that carbon is ultimately released to the atmosphere is much less certain than the fact of physical disturbance. The report cites modelling estimates for carbon released from bottom trawling, but explicitly warns that the estimates remain uncertain. Turning them into a precise emissions claim for a fishery, a vessel or a year would exceed the evidence presented here.
Prospective deep-sea mining adds a different question. Some deep-sea communities recover extremely slowly; experimental disturbances have left long-lived effects. But the ecological and carbon consequences of future industrial mining depend on where and how it occurs, and several Earth-system pathways remain poorly resolved. The appropriate conclusion is precaution and better measurement, not a confident global number for damage that has not yet been observed at industrial scale.
The ocean floor makes the article’s central point tangible. A place that disappears beneath the surface in a climate graphic can still help regulate nutrient exchange, food webs and carbon storage. An ocean policy framed only around harvest, minerals or carbon may miss those connections.
Materials do not vanish when we stop using them
“Novel entities” is the broadest and perhaps least intuitively measurable boundary. It covers human-made substances and modified materials, including synthetic chemicals, plastics, pesticides and persistent compounds. The report’s diagnosis does not require every individual substance to be shown harmful. It reflects an expanding volume and diversity of releases that outpace adequate testing, monitoring and governance.
Some harms are well established. Others remain poorly understood, particularly for mixtures, long-lived substances and very small particles. The 2026 report discusses examples ranging from pesticides and persistent pollutants to plastics. It says the effects of micro- and nanoplastics are not yet sufficiently understood and treats possible effects on the ocean’s biological carbon pump as a subject of ongoing investigation. Those distinctions are important: pervasive presence does not by itself quantify harm, while incomplete evidence does not mean there is no risk.
Materials connect to the other boundaries through their entire lives. Extraction can change land and water systems. Production can consume energy and release greenhouse gases. Use and disposal can introduce substances into air, soil and sea. Collection and recycling can reduce some pressures, but their own energy use, residues and displaced products must be assessed honestly. A circular label is therefore not a full Earth-system assessment.
The analytical challenge is to follow a material beyond the point where one organisation’s responsibility ends. What is made? Which additives are present? Where is it used? What escapes during use? What happens after collection? Which impacts are reduced by a proposed substitute, and which are moved to another boundary or another community? The report does not provide a product-by-product answer. It provides a reason those questions belong in the same conversation.
A different unit of attention
The familiar nine-part chart is a map of where to measure. It is not, by itself, a map of where to act. Action often begins with shared drivers and specific places: a fossil fuel source, a watershed, a forest frontier, a fishing ground, a chemical supply chain. That is Moana Earth’s reading of the 2026 assessment, rather than a new result claimed by the report.
This reading changes how one judges success. An intervention should be measured by the pressure it actually removes, the time it takes to matter, the places it affects and the pressures it may transfer. A lower-carbon system that degrades a carbon-rich habitat would need to explain the trade-off. A pollution-control measure that protects water and biodiversity may deliver benefits that a single-issue scorecard misses. A restored forest should be judged not only by carbon credits but also by survival, water, ecological integrity and permanence.
It also changes how uncertainty is communicated. Some links in the causal network are established and directional; others depend strongly on location or remain under study. The task is to keep those distinctions visible while making decisions. Demanding perfect certainty before reducing well-understood pressures would be a mistake. So would presenting a plausible chain of effects as a measured global outcome.
There is a hopeful precedent inside the report’s diagnosis. The ozone boundary is back within the assessed safe operating space after sustained international action. That history does not prove all boundaries can be restored by the same policy or on the same timescale. It shows that human pressure is not simply a one-way force. Coordinated decisions can alter a planetary trajectory.
What to watch next
The next annual wheel will matter, but the count should not be the only headline. Watch the direction and distance of each control variable from its boundary. Watch whether regional conditions diverge from reassuring global averages, as they do for aerosols. Watch land carbon observations alongside the global net sink: repeated heat, fire, drought, forest mortality and the pace of recovery. Watch measurements of ocean chemistry and the condition of organisms exposed to acidifying waters.
For the seafloor, watch where disturbance occurs, how often it repeats and what monitoring shows about benthic ecosystems and sediment carbon. For novel entities, watch what is actually tested before release, whether harmful substances are phased out, and whether substitution reduces total harm rather than merely changing its name. Above all, watch whether proposed solutions report effects across climate, biodiversity, water, land and pollution together.
The nine boundaries help make planetary change legible. Their value is not diminished by saying they interact. It is enlarged. The Earth system is connected, and so are the risks we create within it. The clearest response is to measure its parts carefully, then act with the whole in view.
Questions about the 2026 assessment
Which seven planetary boundaries are breached?
The 2026 Planetary Health Check identifies climate change, biosphere integrity, land-system change, freshwater change, biogeochemical flows, novel entities and ocean acidification. Stratospheric ozone depletion and atmospheric aerosol loading remain inside their assessed global boundaries, although regional aerosol pollution can still be severe. Crossing a boundary means increasing Earth-system risk; it is not a prediction of immediate collapse or proof that a tipping point has already been reached.
What are “novel entities” in the planetary boundaries framework?
They include human-made chemicals and materials, such as plastics, as well as naturally occurring substances mobilised by people. The current boundary assessment uses a proxy: the share introduced into widespread production and use without adequate safety testing. That share is high enough for the boundary to be considered transgressed. This does not mean every individual substance is proven harmful, nor is it a precise measure of total global damage. The assessment team explains the definition and its limits.
Does bottom trawling release carbon into the atmosphere?
Bottom-contact fishing gear disturbs seabed sediment and the organic carbon stored in it. A North Sea study found lower sediment carbon storage on intensively trawled grounds, with more variable results where trawling was weaker. But disturbed carbon does not all become atmospheric CO₂: some is redeposited, and any CO₂ produced in seawater may not reach the air. The eventual atmospheric amount remains uncertain and depends on place, sediment, gear and repeated disturbance. Seafloor habitat damage matters independently of that unresolved emissions figure.
Sources and editorial notes
- Planetary Boundaries Science, Planetary Health Check 2026: A Scientific Assessment of the State of the Planet, especially the executive summary and chapters 1.1, 1.4, 2.2 and 4.1–4.3; summary report.
- Planetary Boundaries Science, 2026 launch statement and downloadable report figures and image licence.
- Planetary Boundaries Science, explanation of the novel-entities boundary.
- Zhang et al. (2024), “Long-term carbon storage in shelf sea sediments reduced by intensive bottom trawling,” Nature Geoscience.
- The hero is a conceptual illustration supplied for this article, not a measured diagram. The reproduced scientific figures are credited to PBScience 2026 under CC BY 4.0. Captions distinguish measured quantities, conceptual graphics and areas of uncertainty.
Disclosure: Moana Earth is connected to the team behind Ocean Material. For a separate discussion of what the Planetary Health Check may mean for circular-material decisions, see Ocean Material’s article. This report is an independent editorial interpretation of the scientific assessment and makes no claim about any specific product.